The
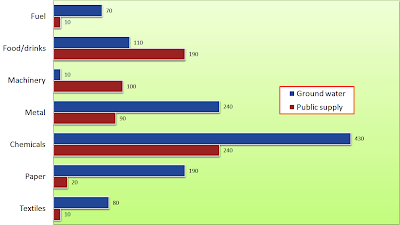
bar chart compares the annual water usage in seven industries such as fuel,
food/drinks, machinery, metal, chemicals, paper, and textile in Somecountry.
The data is calibrated in millions of cubic meters.
It
can be clearly seen that the use of ground water is much higher than public
water supply in all industries except machinery, which the data is recorded
only 10 millions of cubic meters. Fuel uses ground water seven times higher
than machinery (70) and closely followed by textile at 80. The next two
industries have higher rates, food/drinks and paper (110 and 190 respectively).
The highest numbers belong to metal (240) and chemical, which is about twice as
much as metal (430).
Moving
back to the use of public water supply, it reveals that in fuel and textile
industries, the rates are the same with the amount of 10, while in paper
industry, the rates is two times higher (20). The usage data in metal industry
is similar to the machinery industry (90 and 100 respectively). The highest rates
of public water usage are in chemicals industry with the figure of 240, while
in food/drinks industry the figure is only 190.
In
conclusion, the report shows that the ground water is likely to be used in
these several industries rather than the public water supply.
Word: 218


